Tham gia Thử thách PU Xtrader ngay hôm nay
Giao dịch với vốn mô phỏng và kiếm lợi nhuận thực sau khi bạn vượt qua vòng đánh giá trader của chúng tôi.
Tham gia Thử thách PU Xtrader ngay hôm nay
Giao dịch với vốn mô phỏng và kiếm lợi nhuận thực sau khi bạn vượt qua vòng đánh giá trader của chúng tôi.
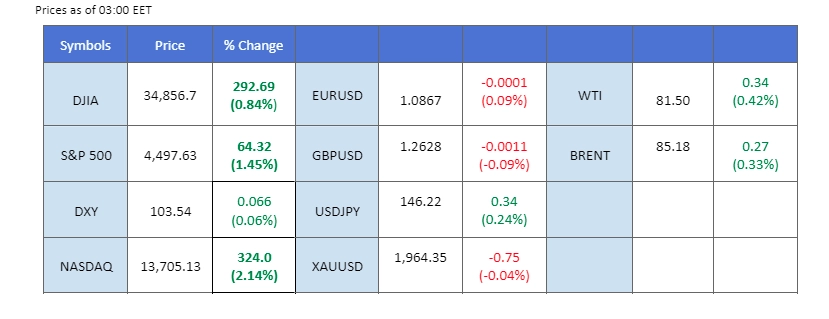
In an unexpected turn, the U.S. JOLTs Job Openings report displayed a decline from its previous reading of 9.17 million to the current figure of 8.83 million, signalling a cooling labour market. This development has heightened the probability of the Fed opting for another rate pause in September. Consequently, the dollar experienced a significant setback of nearly 5%, while U.S. equity markets closed on an upbeat note. Commodities have capitalised on the dollar’s weakened stance, with gold prices inching up by nearly 1%, and oil prices maintaining their foothold above the $81 mark. Additionally, the recent legal victory of Grayscale against the SEC over the Spot-BTC-ETF application has reverberated across the crypto market, propelling Bitcoin to the forefront with an impressive 8% surge.
Current rate hike bets on 20th September Fed interest rate decision:
Source: CME Fedwatch Tool
0 bps (86%) VS 25 bps (14%)


The dollar index experienced a decline yesterday following the release of the JOLTs job opening data. This data revealed indications of a slowdown in the U.S. labour market, raising the likelihood that the Fed might opt for another rate pause in September. Concurrently, U.S. short-term Treasury yields witnessed a drop to their lowest levels in weeks, further aligning with the potential for a Fed rate pause.
The dollar is approaching its next support level at 103.40, which is crucial for it to hold above. Both the RSI and the MACD have declined, suggesting the bullish momentum for the dollar is declining.
Resistance level: 103.85, 104.38
Support level: 103.40, 102.85

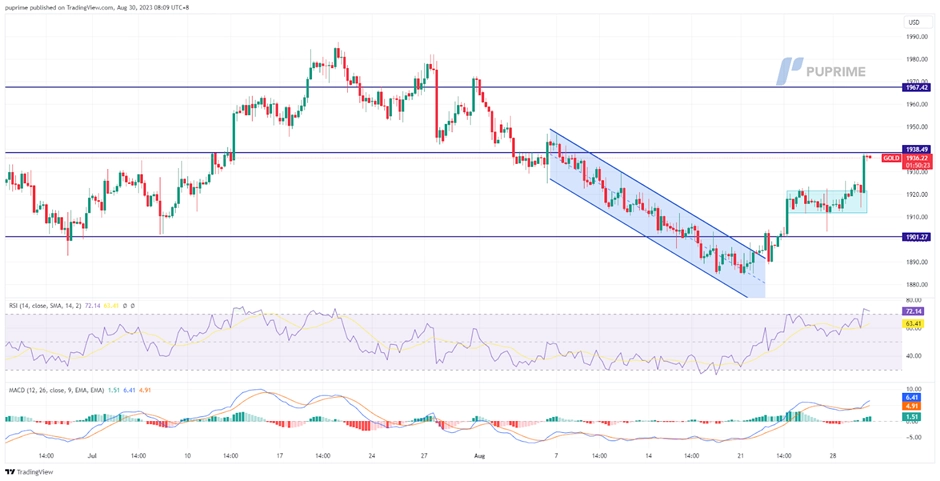
Gold prices capitalised on the weakened dollar, breaking free from its price consolidation range. July’s job data, which significantly shrank to 8.82 million, prompted market speculation of a Fed rate pause in September, subsequently easing the dollar’s strength. Notably, data indicated that retail investors have augmented their bearish bets, with downside exposure surging by 16.3% last night.
Gold prices surged above its week-long price consolidation range and are currently testing their next resistance level near the $1940 level. The RSI has once again broken into the overbought territory while the MACD continues to surge, suggesting a bullish trend for gold prices.
Resistance level: 1939.00, 1967.00
Support level: 1900.00, 1865.00
The euro has achieved a notable breakthrough, surmounting its long-standing downtrend resistance level, driven by the impact of subdued U.S. job data on the dollar’s trajectory. The increasing probability of a Federal Reserve rate pause gains traction as the labour market displays cooling indicators, evidenced by a reduction in job vacancies from a previous reading of 9.165 million to 8.827 million. Investors are poised for close scrutiny of the forthcoming Eurozone CPI release scheduled for Thursday, anticipating insights into the euro’s strength.
The EUR/USD broke above the downtrend resistance level, signalling for a trend reversal price pattern. The RSI is moving upward and MACD is diverging above the zero line, suggesting a bullish momentum is forming.
Resistance level: 1.0925, 1.0990
Support level: 1.0850, 1.0760
The Australian dollar reached its weekly peak, leveraging the weakened dollar’s influence. Simultaneously, Chinese authorities persist in rolling out additional economic stimulus measures to invigorate their economy, which is still recovering sluggishly to pre-pandemic levels. Notably, China’s state banks recently reduced rates on mortgages and deposits, a strategy aimed at boosting consumer spending and channelling funds into the equity market. This strategic manoeuvre from the Chinese government positively reverberates on the Australian dollar, often acting as a proxy for the Chinese currency.
The pair has spiked up yesterday but is currently forming a double-top pattern which may lead to a decline soon. The RSI is moving toward the overbought zone while the MACD has signs of rebound from the zero line, suggesting a bullish momentum is forming.
Resistance level: 0.6500, 0.6580
Support level: 0.6390, 0.6320

The U.S. equity market notched its third consecutive day of gains, with the Dow surging by nearly 300 points in the latest session. This rally was triggered by the release of the JOLTs Job Opening report, which had ripple effects on various aspects of the market. The decline in Treasury yields and moderation in the dollar’s strength followed the job data, indicating a cooling labour market. This shift in sentiment towards a more risk-on attitude was the driving force behind the equity market’s surge. However, investors remain watchful as Friday’s Nonfarm Payroll release approaches, which could bring further market dynamics.
Dow Jones broke above its near resistance level at 34800 and exhibited a strong bullish signal for the index. The RSI attempts to break into the overbought zone while the MACD continues to surge, indicating the bullish momentum is strong.
Resistance level: 35400.00, 36000.00
Support level: 34200.00, 33600.00
The prevailing risk-on sentiment in the U.S. market has resonated across the Asian region, notably reflected in the morning session’s robust performance of the Hang Seng index. Adding to the market optimism, China’s concerted efforts to bolster its sluggish economy persist, deploying further economic stimulus packages. Among these measures, state-owned banks are set to reduce both deposit and mortgage rates, aiming to invigorate consumer spending and channel funds into the underperforming equity market. This strategic policy implementation aims to restore foreign fund confidence, countering the recent significant outflows witnessed in the past month.
The index has rebounded and broken above its resistance level at 18400. a sharp incline in RSI and a cross of MACD at the bottom, signalling a trend reversal for the index.
Resistance level: 19130, 19860
Support level: 18400, 17600
Oil prices saw a modest uptick, benefiting from the weakened dollar. The growing probability of a Fed rate pause, highlighted by job data indicating a cooling labour market, also bolstered support for oil prices. In addition, the API weekly oil stock report revealed a substantial reduction in oil stockpiles, suggesting an increased demand for oil in the U.S. This encouraging sign further propelled oil prices higher.
Oil prices have found support at $80 and are testing the next resistance level around $81.50. The RSI is gradually increasing while the MACD has broken above the zero line, suggesting the oil prices are trading with strong bullish momentum.
Resistance level: 83.25, 87.25
Support level: 79.15, 76.80

Trade forex, indices, cryptocurrencies, and more at industry-low spreads and lightning-fast execution.

12 December 2023, 05:38 All Eyes On U.S. CPI Reading

11 December 2023, 05:23 Dollar Surges On Exceptional Jobs Data

8 December 2023, 05:50 Yen Rallies On BoJ Hawkish Comment

Đăng ký mới không khả dụng
Hiện tại chúng tôi không chấp nhận đăng ký mới.
Mặc dù không thể đăng ký mới, các người dùng hiện tại vẫn có thể tiếp tục các thử thách và hoạt động giao dịch như bình thường.