Tham gia Thử thách PU Xtrader ngay hôm nay
Giao dịch với vốn mô phỏng và kiếm lợi nhuận thực sau khi bạn vượt qua vòng đánh giá trader của chúng tôi.
Tham gia Thử thách PU Xtrader ngay hôm nay
Giao dịch với vốn mô phỏng và kiếm lợi nhuận thực sau khi bạn vượt qua vòng đánh giá trader của chúng tôi.
30 May 2023,06:02
Daily Market Analysis
Global markets experienced a mixed landscape as Western holidays provided a sense of calm for dollar-related currencies. In contrast, Asian markets saw a surge in positive sentiment, driving the Nikkei index to its highest level in over three decades. The announcement of a debt ceiling deal boosted global risk appetite, contributing to a modest increase in oil prices. Market focus now shifts to the upcoming OPEC+ meeting, where discussions on production adjustments and supply dynamics will shape the future trajectory of oil prices. In the US, market participants eagerly await the voting results from Congress, as they hold the key to the progress of the debt ceiling negotiations.
Current rate hike bets on 14th June Fed interest rate decision:
Source: CME Fedwatch Tool
0 bps (38%) VS 25 bps (62%)
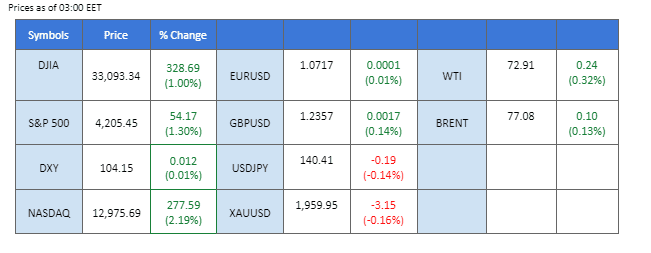

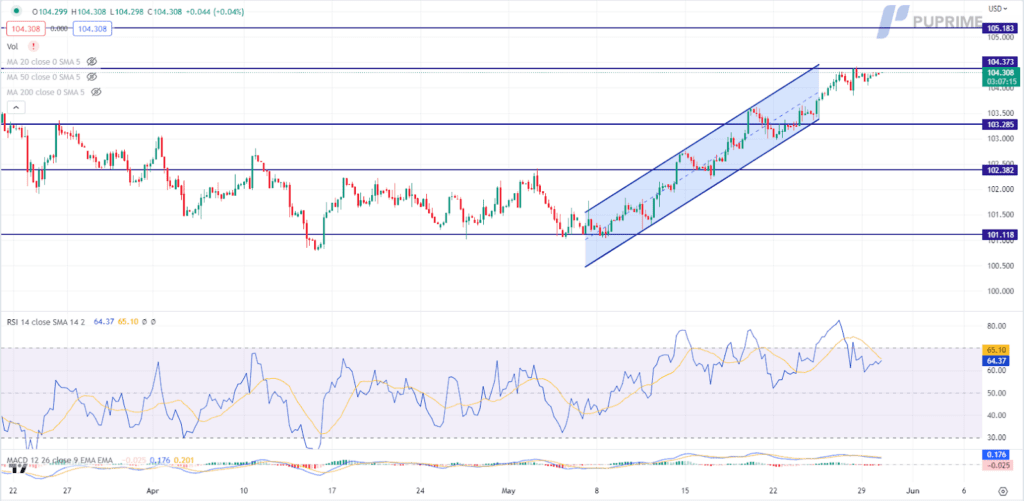
Amidst Western countries’ holidays, the overall volatility for dollar-related currencies have maintained a state of calm. Market participants have shifted their focus towards other Asian markets, seeking potential opportunities and alternative avenues for investment. As for now, market participants should brace themselves for a series of crucial events and data releases, including the debt ceiling vote and Nonfarm Payrolls to gauge the likelihood movement for the US Dollar.
The Dollar Index is trading higher while currently testing the resistance level. However, MACD has illustrated increasing bearish momentum, while RSI is at 64, suggesting the index might be traded lower as technical correction since the RSI retreated sharply from the overbought territory.
Resistance level: 104.40, 105.20
Support level: 103.30, 102.40
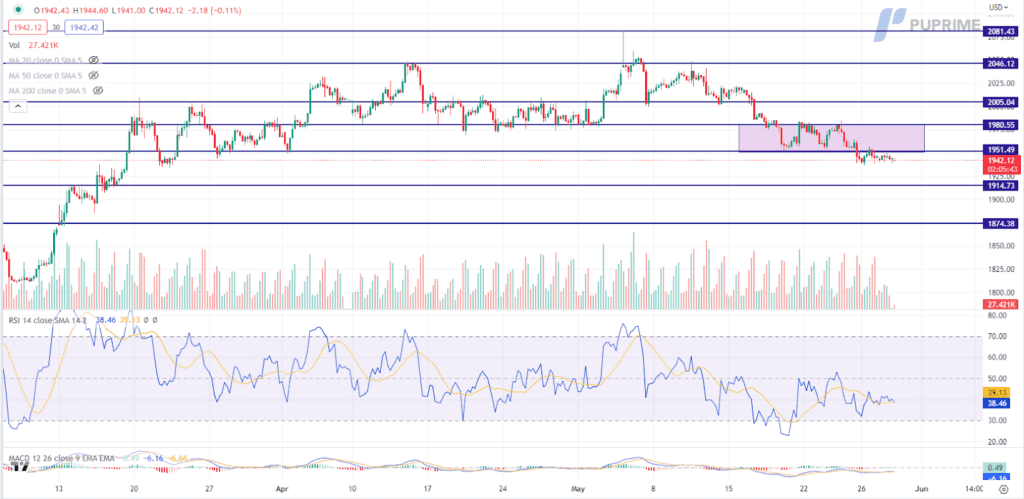
Gold prices remained relatively unchanged in anticipation of a series of significant events and economic data releases scheduled for the week. Investors are closely monitoring the progress of the debt ceiling voting in Congress, as well as the upcoming Non-farm Payrolls report from the United States, in search of crucial trading signals.
Gold prices are trading lower following the prior breakout below the previous support level. MACD has illustrated increasing bearish momentum, while RSI is at 37, suggesting the commodity might extend its losses as the RSI stays below the midline.
Resistance level: 1950.00, 1980.00
Support level: 1915.00, 1875.00
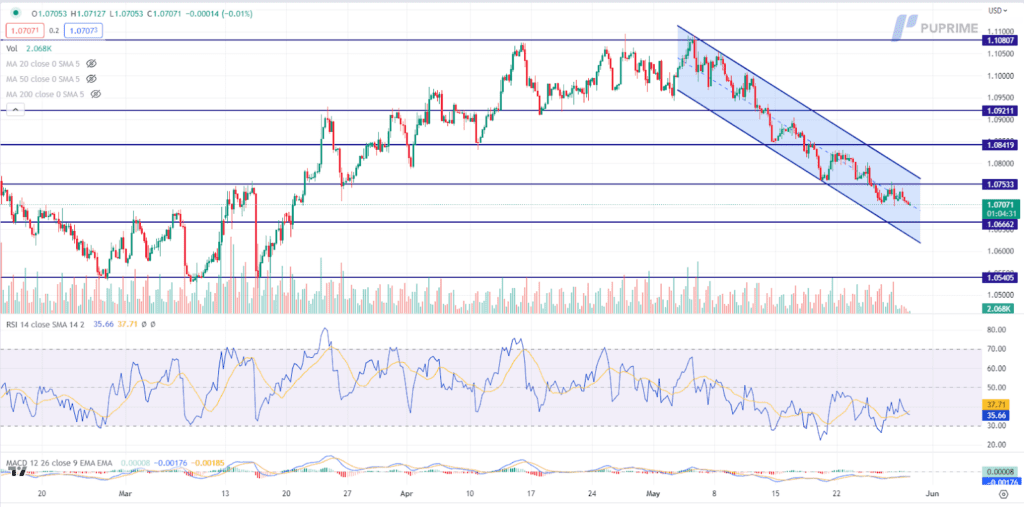
Amidst a dearth of catalysts originating from the European region, the predominant influence on the EUR/USD trend lies in the strengthening of the US Dollar. The appreciation of the US Dollar is primarily driven by heightened inflation expectations and the prevailing optimism surrounding the debt ceiling deal. These factors have incentivized investors to reallocate their portfolios towards the United States, capitalizing on the anticipated positive outcomes. However, lingering uncertainties persist until the voting results from Congress are unveiled, necessitating investors’ continued scrutiny of further developments pertaining to the US debt ceiling deal in order to identify potential trading signals.
The euro is trading lower following the prior breakout below the previous support level. MACD has illustrated diminishing bullish momentum, while RSI is at 36, suggesting the pair might extend its losses toward support level as the RSI stays below the midline.
Resistance level: 1.0755, 1.0840
Support level: 1.0665, 1.0540
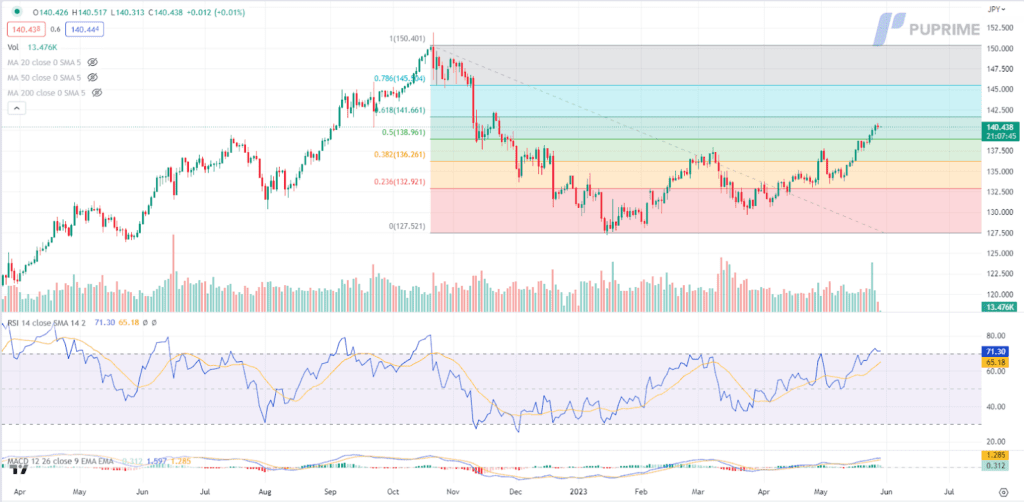
Speculation surrounding a potential easing of monetary policy by the Bank of Japan has intensified as inflation in the region continues to show sluggishness. The yield spread between the US and Japan has widened, further bolstering the bullish momentum on the USD/JPY currency pair. In May, Tokyo’s inflation rate slowed, aligning with the Bank of Japan’s outlook of a deceleration in price gains towards the autumn. In fact, the central bank has emphasized that the decline in commodity prices will exert increasing downward pressure on overall prices throughout the year, projecting inflation to average at 1.8% over the 12 months starting in April.
USD/JPY is trading higher while currently testing the resistance level. MACD has illustrated diminishing bullish momentum, while RSI is at 71, suggesting the pair might enter overbought territory.
Resistance level: 141.65, 145.50
Support level: 138.95, 136.25
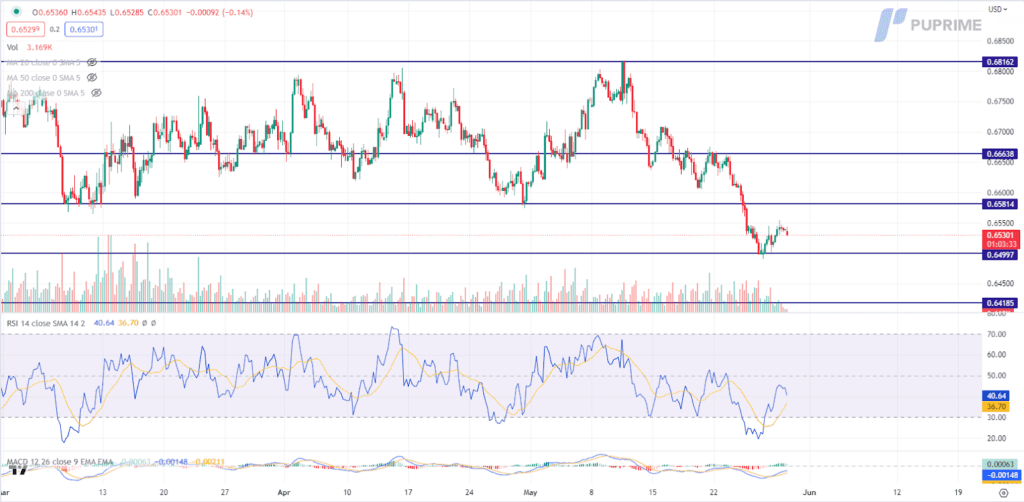
Chinese proxy-currencies, including the Australian Dollar, experienced a modest rebound on the back of positive news regarding the Chinese economy. Recent surveys indicate that China’s manufacturing sector showed signs of improvement or, at the very least, stabilization in May compared to the previous month, according to China Beige Book, a US-based data provider. This development offers some respite following concerns about a slowdown in the economy’s recovery. Given the previous month’s data falling short of forecasts and leading several investment banks to revise down their growth projections for China, economists are paying close attention to Chinese economic releases.
AUD/USD is trading higher following the prior rebound from the support level. MACD has illustrated increasing bullish momentum, while RSI is at 41, suggesting the pair might extend its gains since the RSI rebounded sharply from oversold territory.
Resistance level: 0.6580, 0.6665
Support level: 0.6500, 0.6420
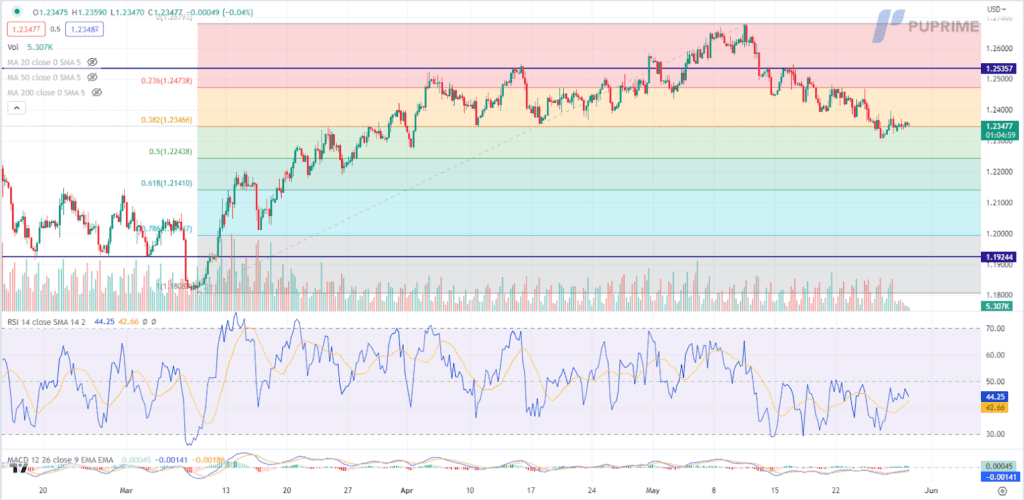
Market holidays resulted in limited movement for Pound Sterling, while British shop prices experienced a notable increase, reaching their highest level since records began in 2005. The British Retail Consortium reported a 9.0% year-on-year rise in prices for supermarkets and retail chains in May, following an 8.8% increase in April. These figures align with recent official data showing a higher level than anticipated reading, at 8.7% in April. With these indications of elevated inflation, the Bank of England is likely to extend its monetary tightening cycle to stabilise prices.
GBPUSD is trading flat while currently testing the support level. MACD has illustrated diminishing bullish momentum, while RSI is at 44, suggesting the pair might extend its losses after successfully breakout since the RSI stays below the midline.
Resistance level: 1.2475, 1.2535
Support level: 1.2345, 1.2245
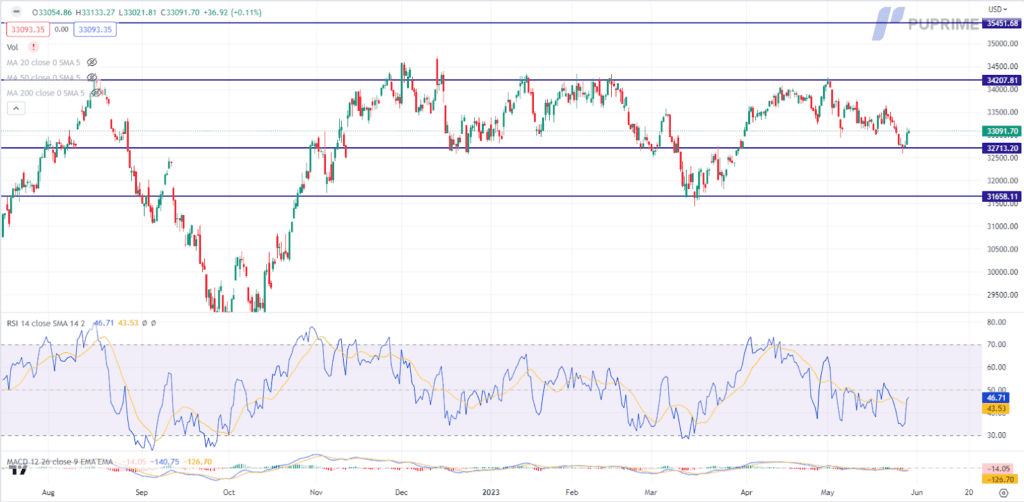
Amidst Western holidays, global equity markets have remained relatively stable, with the Dow’s future showing a slight upward movement. Optimism stems from the advancements in debt ceiling negotiations, as US President Joe Biden and House Speaker Kevin McCarthy have tentatively reached a deal. However, potential obstacles lie ahead, with some hard-right Republican lawmakers expressing opposition to raising the towering $31.4 trillion debt ceiling. As market participants eagerly await the voting results from Congress, the outcome will be crucial in determining the progress of the negotiations. Despite the calmness in the market, risks persist, and investors remain vigilant.
The Dow is trading higher following the prior rebound from the support level. MACD has illustrated diminishing bearish momentum, while RSI is at 47, suggesting the index might extend its gainsas the RSI rebound sharply from its oversold territory.
Resistance level: 34210, 35450
Support level: 32715, 31660
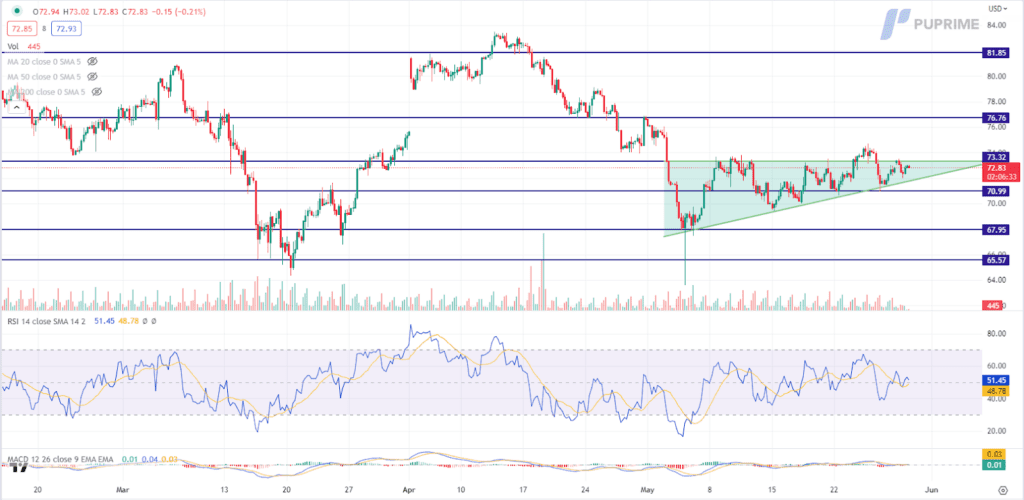
Following the announcement of the debt ceiling deal, global risk appetite experienced a notable uplift, contributing to a modest increase in oil prices. Meanwhile, the OPEC+ meeting has become a focal point for traders and investors, as the potential for production adjustments and supply dynamics loom large, shaping the future trajectory of oil prices. As the eagerly anticipated OPEC+ meeting approaches on June 4, market participants eagerly await the outcome of discussions among member countries.
Crude oil prices are trading higher while currently testing the resistance level. MACD has illustrated diminishing bearish momentum, while RSI is at 52, suggesting the commodity might extend its gains after successfully breakout above the resistance level as the RSI stays above the midline.
Resistance level: 73.30, 76.80
Support level: 71.00, 67.95

Trade forex, indices, cryptocurrencies, and more at industry-low spreads and lightning-fast execution.

12 December 2023, 05:38 All Eyes On U.S. CPI Reading

11 December 2023, 05:23 Dollar Surges On Exceptional Jobs Data

8 December 2023, 05:50 Yen Rallies On BoJ Hawkish Comment