Tham gia Thử thách PU Xtrader ngay hôm nay
Giao dịch với vốn mô phỏng và kiếm lợi nhuận thực sau khi bạn vượt qua vòng đánh giá trader của chúng tôi.
Tham gia Thử thách PU Xtrader ngay hôm nay
Giao dịch với vốn mô phỏng và kiếm lợi nhuận thực sau khi bạn vượt qua vòng đánh giá trader của chúng tôi.
5 June 2023,06:08
Daily Market Analysis
In response to impressive non-farm payroll figures, the US Dollar surged, buoyed by renewed market optimism surrounding the US economic progression. NFP in May saw a remarkable increase of 330,000 jobs, surpassing expectations and outpacing the previous reading. Additionally, President Joe Biden’s signing of the debt ceiling bill relieved global financial markets, diminishing the threat of a catastrophic default. Market sentiment shifted towards riskier assets, including oil and equities, amidst the optimism surrounding the debt ceiling resolution, sparking risk-on sentiment. Furthermore, oil prices surged due to Saudi Arabia’s intention to implement a significant output cut, complementing the broader OPEC+ deal.
Current rate hike bets on 14th June Fed interest rate decision:
Source: CME Fedwatch Tool
0 bps (76%) VS 25 bps (24%)


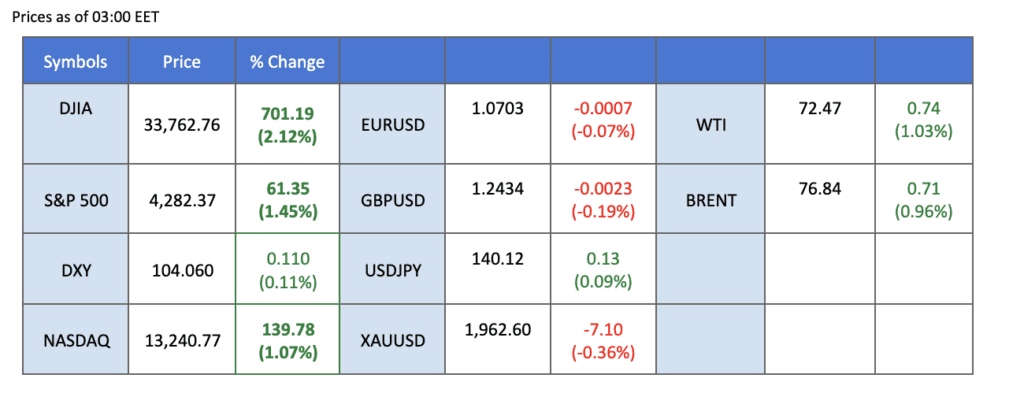
The US Dollar experienced a significant surge in value against its counterparts, propelled by an optimistic backdrop of upbeat nonfarm payroll data. According to the report, the United States witnessed a remarkable increase of 330,000 jobs in May, surpassing market expectations of 190,000 and outpacing the previous reading of 253,000. However, despite the robust hiring, the unemployment rate rose to 3.70% from its 53-year low of 3.40% in April.
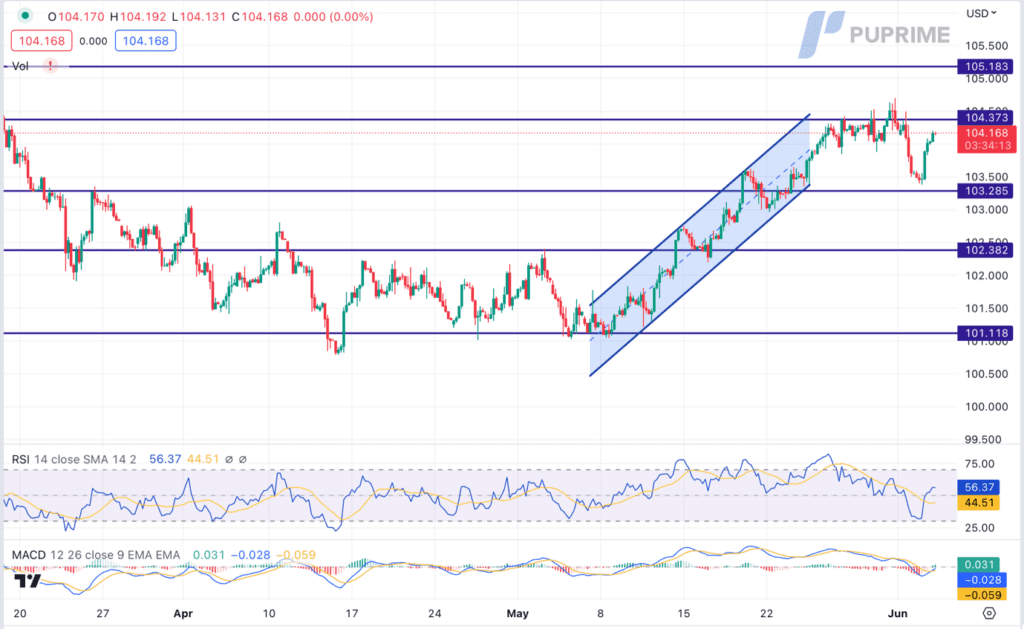
The Dollar Index is trading higher following the prior rebound from the support level. MACD has illustrated increasing bullish momentum, while RSI is at 56, suggesting the index might extend its gains toward resistance level.
Resistance level: 104.35, 105.20
Support level: 103.30, 102.40

Gold prices witnessed a notable slump in response to the strengthening US Dollar, propelled by the release of robust nonfarm payroll data. The upbeat nonfarm payroll data revealed a remarkable increase of 330,000 jobs in May, surpassing market expectations. Furthermore, the signing of the debt ceiling bill by President Joe Biden relieved concerns of a potential default, bolstering market confidence and amplifying the appeal of the US Dollar.
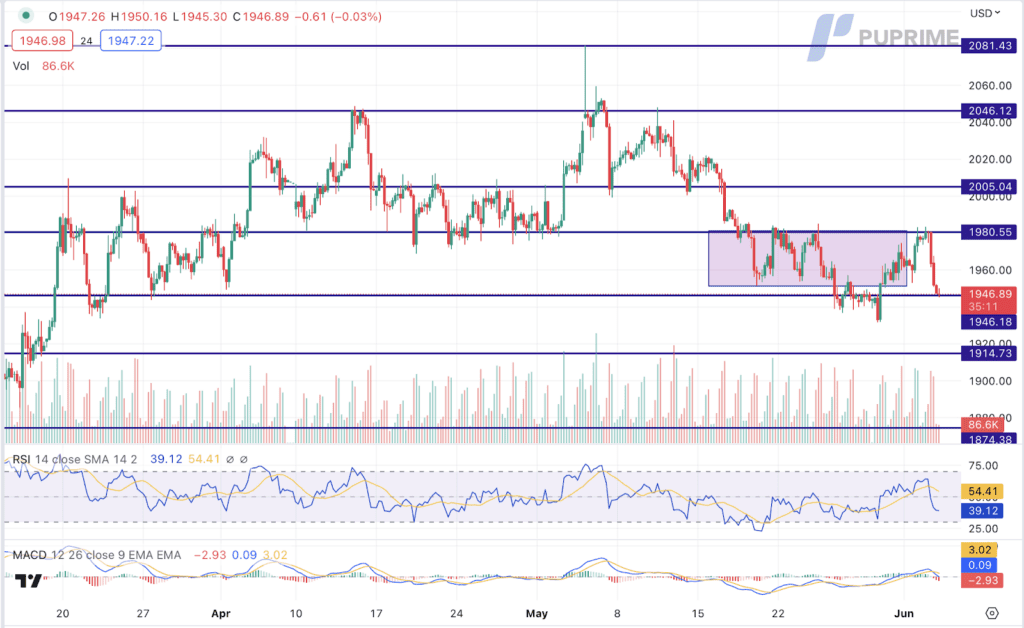
Gold prices are trading lower while currently testing the support level. MACD has illustrated increasing bearish momentum, while RSI is at 39, suggesting the commodity to extend its losses since the RSI stays below the midline.
Resistance level: 1980.00, 2005.00
Support level: 1945.00, 1915.00

The Euro faced a retreat as pessimistic inflation readings diminished the likelihood of the European Central Bank (ECB) tightening its monetary policy. The latest data revealed that inflation in the eurozone eased beyond expectations in May, as flash figures showed a decline in the bloc’s annual headline inflation to 6.1%, down from the previous reading of 7%. This marked the lowest level recorded since February 2022.
EUR/USD is trading lower following the prior retracement from the resistance level. MACD has illustrated diminishing bullish momentum, while RSI is at 43, suggesting the pair might extend its losses since the RSI stays below the midline.
Resistance level: 1.0755, 1.0840
Support level: 1.0665, 1.0540

USD/JPY remains on a bullish trajectory, propelled by positive economic data from the United States and optimism surrounding the resolution of the debt ceiling issue. The upbeat economic indicators from the US region, coupled with the prospects of averted default risks, have widened the yield spread between Japan and the United States. This yield differential has bolstered the attractiveness of the US Dollar against the Japanese Yen.
USD/JPY is trading higher following the prior breakout above the previous resistance level. However, MACD has illustrated diminishing bullish momentum, while RSI is at 65, suggesting the pair might enter overbought territory.
Resistance level: 142.05, 146.20
Support level: 138.50, 133.85

AUD/USD experienced a prevailing bearish momentum, primarily attributed to a lack of significant market catalysts from the Australia region. However, the dominant factor contributing to the downward pressure on AUD/USD was the strengthening of the US Dollar following the release of robust economic data from the United State
AUD/USD is trading lower while currently testing the support level. MACD has illustrated diminishing bullish momentum, while RSI is at 59, suggesting the pair might extend its losses after breakout since the RSI retreated sharply from overbought territory.
Resistance level: 0.6665, 0.6745
Support level: 0.6580, 0.6500

GBP/USD pair struggled to gain traction as a dearth of market catalysts from the UK region dampened investor sentiment. The predominant bearish momentum in the currency pair was further exacerbated by the resurgent strength of the US Dollar. Buoyed by the release of robust Nonfarm Payroll data, which surpassed market expectations, and the successful resolution of the debt ceiling issues, market confidence in the Dollar continued to soar.
GBP/USD is trading lower following the prior retracement from the resistance level. MACD has illustrated increasing bearish momentum, while RSI is at 48, suggesting the pair might extend its losses since the RSI stays below the midline.
Resistance level: 1.2475, 1.2535
Support level: 1.2345, 1.2195

The Dow Jones Industrial Average experienced a significant surge in the wake of US President Joe Biden signing the debt ceiling bills, successfully averting a potential default. The resolution of the debt ceiling issue has instilled a prevailing sense of optimism among market participants, leading to a shift in sentiment towards riskier assets, particularly the US equity market.
The Dow is trading higher following prior rebounded from the support level. MACD has illustrated increasing bullish momentum, while RSI is at 64, suggesting the index might extend its gains toward resistance level since the RSI rebounded sharply from the support level.
Resistance level: 34210.00, 35475.00
Support level: 32715.00, 31660.00

Oil prices witnessed a substantial surge as Saudi Arabia announced its intention to implement a significant cut to its output in July, in addition to the broader OPEC+ deal to restrict supply until 2024, all aimed at bolstering oil prices. Saudi Arabia’s energy ministry confirmed that the country’s output would decrease to 9 million barrels per day (bpd) in July, marking the largest reduction in years, compared to the approximately 10 million bpd in May.
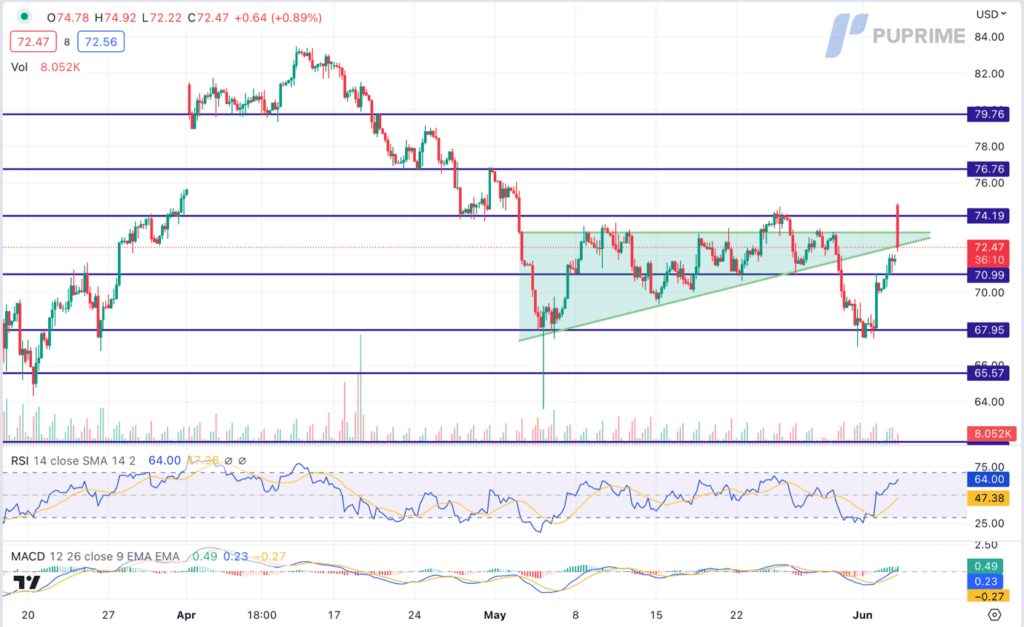
Oil prices are trading higher while currently near the resistance level. MACD has illustrated increasing bullish momentum, while RSI is at 64, suggesting the commodity might continue to extend its gains since the RSI stays above the midline.
Resistance level: 74.20, 76.75
Support level: 71.00, 67.95

Trade forex, indices, cryptocurrencies, and more at industry-low spreads and lightning-fast execution.

12 December 2023, 05:38 All Eyes On U.S. CPI Reading

11 December 2023, 05:23 Dollar Surges On Exceptional Jobs Data

8 December 2023, 05:50 Yen Rallies On BoJ Hawkish Comment